 IDG
IDG
 IDG
IDG
 IDG
IDG

Dell Latitude E6410 Notebook| Quantity Available: 40+
This post is intended for businesses and other organizations interested... Read more →
Posted by Richy George on 16 May, 2024

In May 1974, Donald Chamberlin and Raymond Boyce published a paper on SEQUEL, a structured query language that could be used to manage and sort data. After a change in title due to another company’s copyright on the word SEQUEL, Structured Query Language (SQL) was taken up by database companies like Oracle alongside their new-fangled relational database products later in the 1970s. The rest, as they say, is history.
SQL is now 50 years old. SQL was designed and then adopted around databases, and it has continued to grow and develop as a way to manage and interact with data. According to Stack Overflow, it is the third most popular language used by professional programmers on a regular basis. In 2023, the IEEE noted that SQL was the most popular language for developers to know when it came to getting a job, due to how it could be combined with other programming languages.
When you look at other older languages being used today, the likes of COBOL (launched in 1959) and FORTRAN (first compiled in 1958) are still going, too. While they can lead to well-paying roles, they are linked to existing legacy deployments rather than new and exciting projects. SQL, on the other hand, is still being used as part of work around AI, analytics, and software development. It continues to be the standard for how we interact with data on a daily basis.
When you look at SQL, you may ask why it has survived—even thrived—for so long. It is certainly not easy to learn, as it has a peculiar syntax that is very much of its time. The user experience around SQL can be challenging for new developers to pick up. Alongside this, every database vendor has to support SQL, but each also will have their own quirks or nuances in how they implement this support. Consequently, your approach for one database may not translate to another database easily, leading to both more work and more support requirements.
To make matters worse, it is easy to make mistakes in SQL that can have real and potentially catastrophic consequences. For example, missing a WHERE clause in your instructions can cause you to delete an entire table rather than carrying out the transaction you want, leading to lost data and recovery work. Checking your logic and knowing how things work in practice is a necessary requirement.
So why is SQL still the leading way to work with data today, 50 years after it was first designed and released? SQL is based on strong mathematical theory, so it continues to perform effectively and support the use cases it was designed for. The truth is that when you combine SQL with relational databases, you can map the data that you create—and how you manage that data—to many business practices in a way that is reliable, effective, and scalable. Put simply, SQL works, and no replacement option has measured up in the same way.
As an example, SQL was the first programming language to return multiple rows per single request. This makes it easier to get data on what is taking place within a set of data—and consequently, within the business and its applications—and then turn it into something the business can use. Similarly, SQL made it easier to compartmentalize and segregate information into different tables, and then use the data in those tables for specific business tasks, such as putting customer data in one table and manufacturing data in another. The ability to perform transactions is the backbone of most processes today, and SQL made that possible at scale.
Another important reason for the success of SQL is that the language has always moved with the times. From its relational roots, SQL has added support for geographic information system (GIS) data, for JSON documents, and for XML and YAML over the years. This has kept SQL up to speed with how developers want to interact with data. Now, SQL can be combined with vector data, enabling developers to interact with data using SQL but carrying out vector searches for generative AI applications.
There have been attempts to replace SQL in the past. NoSQL (Not only SQL) databases were developed to replace relational databases and get away from the traditional models of working with and managing data at scale. However, rather than replacing SQL, these databases added their own SQL-like languages that replicated some of the methods and approaches that SQL has ingrained into how developers work.
In the past, natural language processing advocates have called for new methods that do away with SQL’s standardized and clunky approach. However, these attempts have ended up with methods that were just as clunky as what they tried to replace, which led to them being sidelined or ignored. Generative AI may take on more of the task of writing SQL for developers, as large language models have been exposed to large quantities of SQL code as part of their training. However, while this approach may develop and become more popular in time, it still relies on SQL for the actual interaction with those sets of data and to deliver the results back to the user. If anything, this will likely make SQL more important for the future, not less, even though it will be less visible to the developer.
Even if SQL ends up moving behind the curtain, it will continue to play a critical role in how we interact with and use data. With such a huge percentage of all our IT systems relying on data to function, SQL will not be going away any time soon. So, let’s celebrate SQL turning 50, and consider how we can continue to develop and use it in the future.
Charly Batista is PostgreSQL technical lead at Percona.
—
New Tech Forum provides a venue for technology leaders—including vendors and other outside contributors—to explore and discuss emerging enterprise technology in unprecedented depth and breadth. The selection is subjective, based on our pick of the technologies we believe to be important and of greatest interest to InfoWorld readers. InfoWorld does not accept marketing collateral for publication and reserves the right to edit all contributed content. Send all inquiries to doug_dineley@foundryco.com.
Next read this:
Posted by Richy George on 15 May, 2024

Most people assume that analytical databases, or OLAPs, are big, powerful beasts—and they are correct. Systems like Snowflake, Redshift, or Postgres involve a lot of setup and maintenance, even in their cloud-hosted incarnations. But what if all you want is “just enough” analytics for a dataset on your desktop? In that case, DuckDB is worth exploring.
DuckDB is a tiny but powerful analytics database engine—a single, self-contained executable, which can run standalone or as a loadable library inside a host process. There’s very little you need to set up or maintain with DuckDB. In this way, it is more like SQLite than the bigger analytical databases in its class.
DuckDB is designed for column-oriented data querying. It ingests data from sources like CSV, JSON, and Apache Parquet, and enables fast querying using familiar SQL syntax. DuckDB supports libraries for all the major programming languages, so you can work with it programmatically using the language of your choice. Or you can use DuckDB’s command-line interface, either on its own or as part of a shell pipeline.
When you work with data in DuckDB, there are two modes you can use for that data. Persistent mode writes the data to disk so it can handle workloads bigger than system memory. This approach comes at the cost of some speed. In-memory mode keeps the data set entirely in memory, which is faster but retains nothing once the program ends. (SQLite can be used the same way.)
DuckDB can ingest data from a variety of formats. CSV, JSON, and Apache Parquet files are three of the most common. With CSV and JSON, DuckDB by default attempts to figure out the columns and data types on its own, but you can override that process as needed—for instance, to specify a format for a date column.
Other databases, like MySQL or Postgres, can also be used as data sources. You’ll need to load a DuckDB extension (more on this later) and provide a connection string to the database server; DuckDB doesn’t read the files for those databases directly. With SQLite, though, you connect to the SQLite database file as though it were just another data file.
To load data into DuckDB from an external source, you can use an SQL string, passed directly into DuckDB:
SELECT * FROM read_csv('data.csv');
You can also use methods in the DuckDB interface library for a given language. With the Python library for DuckDB, ingesting looks like this:
import duckdb
duckdb.read_csv("data.csv")
You can also query certain file formats directly, like Parquet:
SELECT * FROM 'test.parquet';
You can also issue file queries to create a persistent data view, which is usable as a table for multiple queries:
CREATE VIEW test_data AS SELECT * FROM read_parquet('test.parquet');
DuckDB has optimizations for working with Parquet files, so that it reads only what it needs from the file.
Other interfaces like ADBC and ODBC can also be used. ODBC serves as a connector for data visualization tools like Tableau.
Data imported into DuckDB can also be re-exported in many common formats: CSV, JSON, Parquet, Microsoft Excel, and others. This makes DuckDB useful as a data-conversion tool in a processing pipeline.
Once you’ve loaded data into DuckDB, you can query it using SQL expressions. The format for such expressions is no different from regular SQL queries:
SELECT * FROM users WHERE ID>1000 ORDER BY Name DESC LIMIT 5;
If you’re using a client API to query DuckDB, you can pass SQL strings through the API, or you can use the client’s relational API to build up queries programmatically. In Python, reading from a JSON file and querying it might look like this:
import duckdb
file = duckdb.read_json("users.json")
file.select("*").filter("ID>1000").order("Name").limit(5)
If you use Python, you can use the PySpark API to query DuckDB directly, although DuckDB’s implementation of PySpark doesn’t yet support the full feature set.
DuckDB’s dialect of SQL closely follows most common SQL dialects, although it comes with a few gratuitous additions for the sake of analytics. For instance, placing the SAMPLE clause in a query lets you run a query using only a subset of the data in a table. The resulting query runs faster but it may be less accurate. DuckDB also supports the PIVOT keyword (for creating pivot tables), window functions and QUALIFY clauses to filter them, and many other analytics functions in its SQL dialect.
DuckDB isn’t limited to the data formats and behaviors baked into it. Its extension API makes it possible to write third-party add-ons for DuckDB to support new data formats or other behaviors.
Some of the functionality included with DuckDB is implemented through first-party add-ons, like support for Parquet files. Others, like MySQL or Postgres connectivity, or vector similarity search, are also maintained by DuckDB’s team but provided separately.
Next read this:
Posted by Richy George on 15 May, 2024
Most people assume that analytical databases, or OLAPs, are big, powerful beasts—and they are correct. Systems like Snowflake, Redshift, or Postgres involve a lot of setup and maintenance, even in their cloud-hosted incarnations. But what if all you want is “just enough” analytics for a dataset on your desktop? In that case, DuckDB is worth exploring.
DuckDB is a tiny but powerful analytics database engine—a single, self-contained executable, which can run standalone or as a loadable library inside a host process. There’s very little you need to set up or maintain with DuckDB. In this way, it is more like SQLite than the bigger analytical databases in its class.
DuckDB is designed for column-oriented data querying. It ingests data from sources like CSV, JSON, and Apache Parquet, and enables fast querying using familiar SQL syntax. DuckDB supports libraries for all the major programming languages, so you can work with it programmatically using the language of your choice. Or you can use DuckDB’s command-line interface, either on its own or as part of a shell pipeline.
When you work with data in DuckDB, there are two modes you can use for that data. Persistent mode writes the data to disk so it can handle workloads bigger than system memory. This approach comes at the cost of some speed. In-memory mode keeps the data set entirely in memory, which is faster but retains nothing once the program ends. (SQLite can be used the same way.)
DuckDB can ingest data from a variety of formats. CSV, JSON, and Apache Parquet files are three of the most common. With CSV and JSON, DuckDB by default attempts to figure out the columns and data types on its own, but you can override that process as needed—for instance, to specify a format for a date column.
Other databases, like MySQL or Postgres, can also be used as data sources. You’ll need to load a DuckDB extension (more on this later) and provide a connection string to the database server; DuckDB doesn’t read the files for those databases directly. With SQLite, though, you connect to the SQLite database file as though it were just another data file.
To load data into DuckDB from an external source, you can use an SQL string, passed directly into DuckDB:
SELECT * FROM read_csv('data.csv');
You can also use methods in the DuckDB interface library for a given language. With the Python library for DuckDB, ingesting looks like this:
import duckdb
duckdb.read_csv("data.csv")
You can also query certain file formats directly, like Parquet:
SELECT * FROM 'test.parquet';
You can also issue file queries to create a persistent data view, which is usable as a table for multiple queries:
CREATE VIEW test_data AS SELECT * FROM read_parquet('test.parquet');
DuckDB has optimizations for working with Parquet files, so that it reads only what it needs from the file.
Other interfaces like ADBC and ODBC can also be used. ODBC serves as a connector for data visualization tools like Tableau.
Data imported into DuckDB can also be re-exported in many common formats: CSV, JSON, Parquet, Microsoft Excel, and others. This makes DuckDB useful as a data-conversion tool in a processing pipeline.
Once you’ve loaded data into DuckDB, you can query it using SQL expressions. The format for such expressions is no different from regular SQL queries:
SELECT * FROM users WHERE ID>1000 ORDER BY Name DESC LIMIT 5;
If you’re using a client API to query DuckDB, you can pass SQL strings through the API, or you can use the client’s relational API to build up queries programmatically. In Python, reading from a JSON file and querying it might look like this:
import duckdb
file = duckdb.read_json("users.json")
file.select("*").filter("ID>1000").order("Name").limit(5)
If you use Python, you can use the PySpark API to query DuckDB directly, although DuckDB’s implementation of PySpark doesn’t yet support the full feature set.
DuckDB’s dialect of SQL closely follows most common SQL dialects, although it comes with a few gratuitous additions for the sake of analytics. For instance, placing the SAMPLE clause in a query lets you run a query using only a subset of the data in a table. The resulting query runs faster but it may be less accurate. DuckDB also supports the PIVOT keyword (for creating pivot tables), window functions and QUALIFY clauses to filter them, and many other analytics functions in its SQL dialect.
DuckDB isn’t limited to the data formats and behaviors baked into it. Its extension API makes it possible to write third-party add-ons for DuckDB to support new data formats or other behaviors.
Some of the functionality included with DuckDB is implemented through first-party add-ons, like support for Parquet files. Others, like MySQL or Postgres connectivity, or vector similarity search, are also maintained by DuckDB’s team but provided separately.
Next read this:
Posted by Richy George on 2 May, 2024

MongoDB has made Atlas Stream Processing, a new capability it trailed last June, generally available, it announced at its MongoDB.local event in New York City.
It added Atlas Stream processing to its NoSQL Atlas database-as-a-service (DBaaS) in order to help enterprises manage real-time streaming data from multiple sources in a single interface.
The new interface that can process any kind of data and has a flexible data model, bypassing the need for developers to use multiple specialized programming languages, libraries, application programming interfaces (APIs), and drivers, while avoiding the complexity of using these multiple tools, the company said, adding that it can work with both streaming and historical data using the document model.
Atlas Search Nodes is also generally available on AWS and Google Cloud, although the capability is still in preview on Microsoft Azure. This too was showcased last year: It’s a new capability inside the Atlas database that isolates search workloads from database workloads in order to maintain database and search performance.
Users will have to wait for one new capability: Atlas Edge Server. This feature, now in preview, gives developers the capability to deploy and operate distributed applications in the cloud and at the edge, the company said. It provides a local instance of MongoDB with a synchronization server that runs on local or remote infrastructure and significantly reduces the complexity and risk involved in managing applications in edge environments, allowing applications to access operational data even with intermittent connections to the cloud.
One other MongoDB feature also entered general availability: its Vector Search integration with AWS’ generative AI service, Amazon Bedrock. This means that enterprises can use the integration to customize foundation large language models with real-time operational data by converting it into vector embeddings.
Further, enterprises can also use Agents for Amazon Bedrock for retrieval-augmented generation (RAG), the company said.
Next read this:
Posted by Richy George on 2 May, 2024

Oracle is making the latest long-term support release version of its database offering — Database 23c — generally available for enterprises under the name Oracle Database 23ai.
The change in nomenclature can be attributed to the addition of new features to the database that are expected to help with AI-based application development among other tasks, the company said.
Database 23c, showcased for the first time at the company’s annual event in 2022, was released to developers in early 2023 before being released to enterprises, marking a shift in the company’s tradition for the first time.
Stiff competition from database rivals forced Oracle to shift its strategy for its databases business in favor of developers, who could offer the company a much-needed impetus for growth.
In September last year, Oracle said it was working on adding vector search capabilities to Database 23c at its annual CloudWorld conference.
These capabilities, dubbed AI Vector Search, included a new vector data type, vector indexes, and vector search SQL operators that enable the Oracle Database to store the semantic content of documents, images, and other unstructured data as vectors, and use these to run fast similarity queries, the company said.
AI Vector Search in Database 23c that has been passed onto 23ai along with other features, according to the company, also supports retrieval-augmented generation (RAG), a generative AI technique, that combines large language models (LLMs) and private business data to deliver responses to natural language questions.
Other notable features of Database 23c that have been passed onto 23ai include JSON Relational Duality, which unifies the relational and document data models, SQL support for Graph queries directly on OLTP data, and stored procedures in JavaScript, allowing developers to build applications in either relational or JSON paradigms.
Database 23ai, according to Oracle, will be available as a cloud service as well as on-premises through a variety of offerings, including Oracle Exadata Database Service, Oracle Exadata Cloud@Customer, and Oracle Base Database Service, as well as on Oracle Database@Azure.
While Oracle did not release Database 23ai’s pricing, the developer version of Database 23c continues to be free since its release.
The reason to offer Database 23c for free can be attributed to the company’s strategy to lower the barriers to the adoption of its database as rival database providers also add newer features, such as vector search, to support AI workloads.
Several database vendors, such as MongoDB, AWS, Google Cloud, Microsoft, Zilliz, DataStax, Pinecone, Couchbase, Snowflake, and SingleStore, have all added capabilities to support AI-based tasks.
Vector databases and vector search are two technologies that developers use to convert unstructured information into vectors, now more commonly called embeddings.
These embeddings, in turn, make storing, searching, and comparing the information easier, faster, and significantly more scalable for large datasets.
Next read this:
Posted by Richy George on 30 April, 2024
Data has the potential to provide transformative business insights across various industries, yet harnessing that data presents significant challenges. Many businesses struggle with data overload, with vast amounts of data that are siloed and underutilized. How can organizations deal with large and growing volumes of data without sacrificing performance and operational efficiency? Another challenge is extracting insights from complex data. Traditionally, this work has required significant technical expertise, restricting access to specialized data scientists and analysts.
Recent AI breakthroughs in natural language processing are democratizing data access, enabling a wider range of users to query and interpret complex data sets. This broadened access helps organizations make informed decisions swiftly, capitalizing on the capability of AI copilots to process and analyze large-scale data in real time. AI copilots can also curb the high costs associated with managing large data sets by automating complex data processes and empowering less technical staff to undertake sophisticated data analysis, thus optimizing overall resource allocation.
Generative AI and large language models (LLMs) are not without their shortcomings, however. Most LLMs are built on general purpose, public knowledge. They won’t know the specific and sometimes confidential data of a particular organization. It’s also very challenging to keep LLMs up-to-date with ever-changing information. The most serious problem, however, is hallucinations—when the statistical processes in a generative model generate statements that simply aren’t true.
There’s an urgent need for AI that is more contextually relevant and less error-prone. This is particularly vital in predictive analytics and machine learning, where the quality of data can directly impact business outcomes.
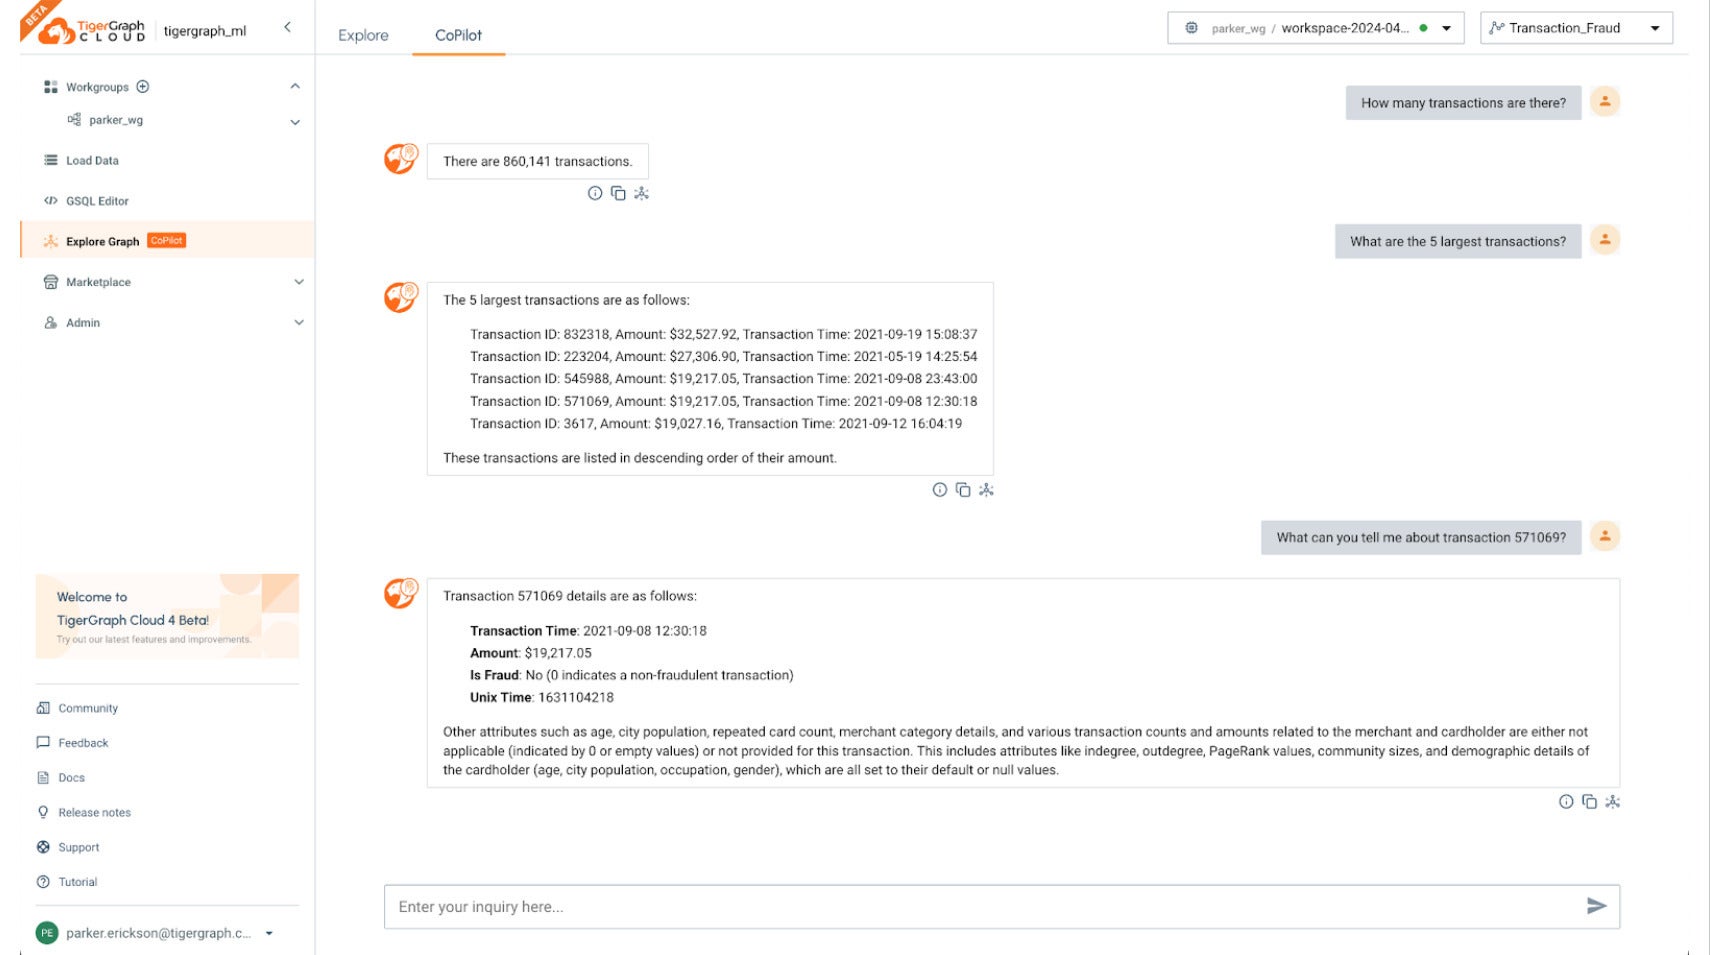
TigerGraph CoPilot is an AI assistant that combines the powers of graph databases and generative AI to enhance productivity across various business functions, including analytics, development, and administration tasks. TigerGraph CoPilot allows business analysts, data scientists, and developers to use natural language to execute real-time queries against up-to-date data at scale. The insights can then be presented and analyzed through natural language, graph visualizations, and other perspectives.
TigerGraph CoPilot adds value to generative AI applications by increasing accuracy and reducing hallucinations. With CoPilot, organizations can tap the full potential of their data and drive informed decision-making across a spectrum of domains, including customer service, marketing, sales, data science, devops, and engineering.
TigerGraph CoPilot allows non-technical users to use their everyday speech to query and analyze their data, freeing them to focus on mining insights rather than having to learn a new technology or computer language. For each question, CoPilot employs a novel three-phase interaction with both the TigerGraph database and a LLM of the user’s choice, to obtain accurate and relevant responses.
The first phase aligns the question with the particular data available in the database. TigerGraph CoPilot uses the LLM to compare the question with the graph’s schema and replace entities in the question by graph elements. For example, if there is a vertex type of BareMetalNode and the user asks “How many servers are there?,” then the question will be translated to “How many BareMetalNode vertices are there?”
In the second phase, TigerGraph CoPilot uses the LLM to compare the transformed question with a set of curated database queries and functions in order to select the best match. Using pre-approved queries provides multiple benefits. First and foremost, it reduces the likelihood of hallucinations, because the meaning and behavior of each query has been validated. Second, the system has the potential of predicting the execution resources needed to answer the question.
In the third phase, TigerGraph CoPilot executes the identified query and returns the result in natural language along with the reasoning behind the actions. CoPilot’s graph-augmented natural language inquiry provides strong guardrails, mitigating the risk of model hallucinations, clarifying the meaning of each query, and offering an understanding of the consequences.
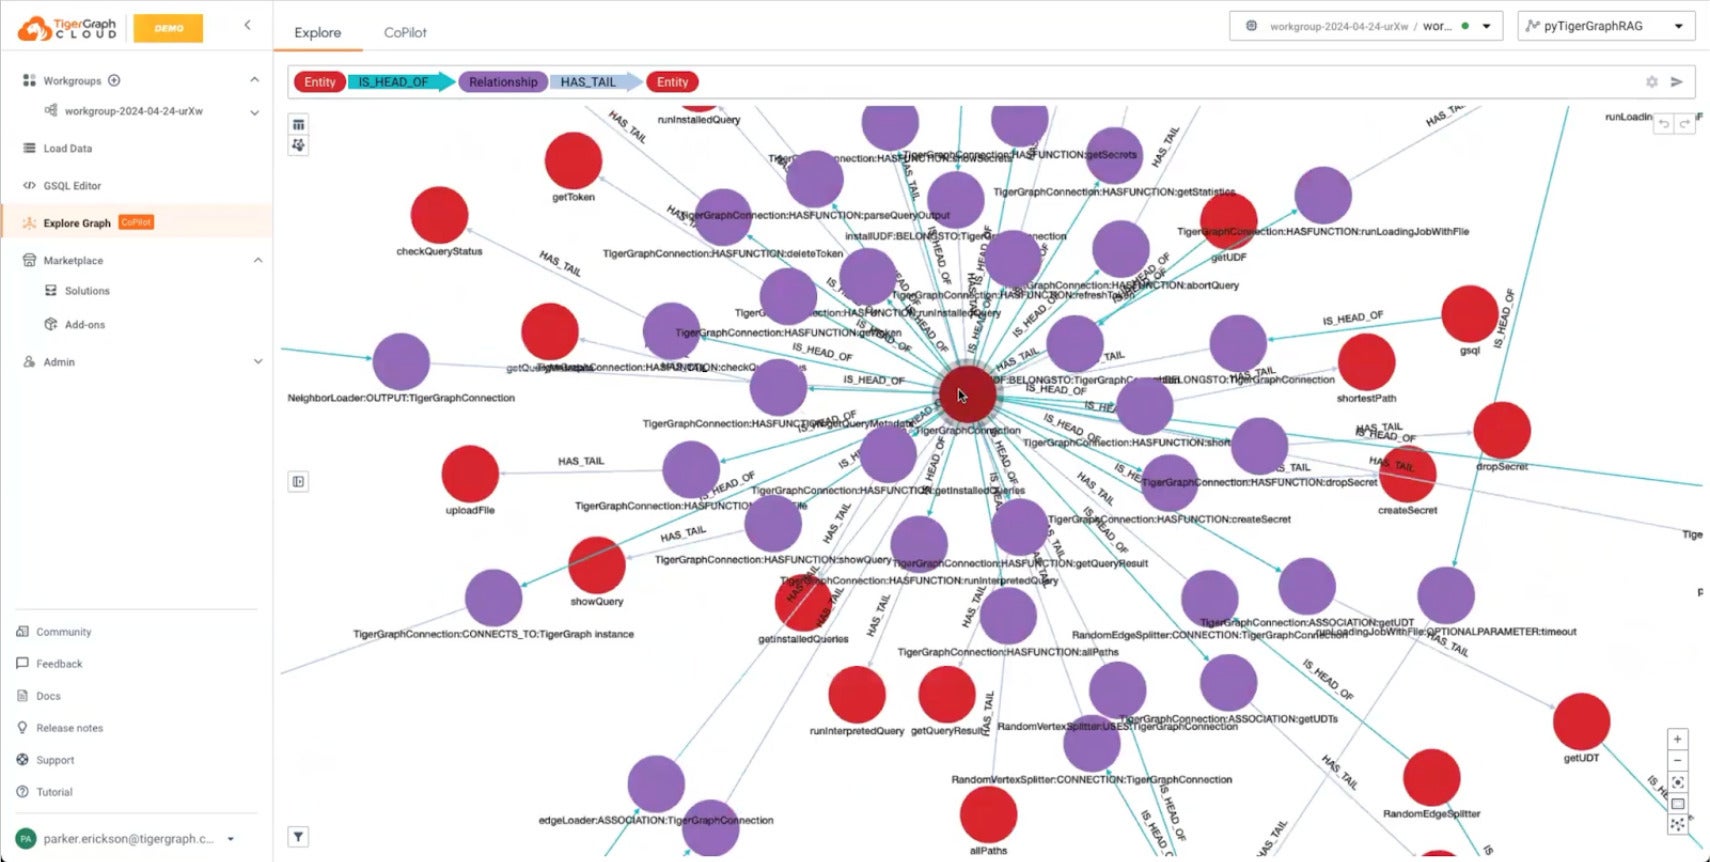
TigerGraph CoPilot also can create chatbots with graph-augmented AI on a user’s own documents. There’s no need to have an existing graph database. In this mode of operation, TigerGraph CoPilot builds a knowledge graph from source material and applies its unique variant of retrieval-augmented generation (RAG) to improve the contextual relevance and accuracy of answers to natural language questions.
First, when loading users’ documents, TigerGraph CoPilot extracts entities and relationships from document chunks and constructs a knowledge graph from the documents. Knowledge graphs organize information in a structured format, connecting data points through relationships. CoPilot will also identify concepts and build an ontology, adding semantics and reasoning to the knowledge graph, or users can provide their own concept ontology. Then, using this comprehensive knowledge graph, CoPilot performs hybrid retrievals, combining traditional vector search and graph traversals, to collect more relevant information and richer context to answer users’ questions.
Organizing the data as a knowledge graph allows a chatbot to access accurate, fact-based information quickly and efficiently, thereby reducing the reliance on generating responses from patterns learned during training, which can sometimes be incorrect or outdated.
TigerGraph CoPilot mitigates hallucinations by allowing LLMs to access the graph database via curated queries. It also adheres to the same role-based access control and security measures (already part of the TigerGraph database) to assure responsible AI. TigerGraph CoPilot also supports openness and transparency by open-sourcing its major components and allowing users to choose their LLM service.
By leveraging the TigerGraph database, TigerGraph CoPilot brings high performance to graph analytics. As a graph-RAG solution, it supports large-scale knowledge bases for knowledge graph-powered Q&A solutions.
Whether you are a business analyst, specialist, or investigator, TigerGraph CoPilot enables you to get information and insights quickly from your data. For example, CoPilot can generate reports for fraud investigators by answering questions like “Show me the list of recent fraud cases that were false positives.” CoPilot also facilitates more accurate investigations like “Who had transactions with account 123 in the past month with amounts larger than $1000?”
TigerGraph CoPilot can even answer “What if” questions by traversing your graph along dependencies. For example, you can easily find out “What suppliers can cover the shortage of part 123?” from your supply chain graph, or “What services would be affected by an upgrade to server 321” from your digital infrastructure graph.
TigerGraph CoPilot provides a complete solution for building Q&A chatbot on your own data and documents. Its knowledge graph-based RAG approach enables contextually accurate information retrieval that facilitates better answers and more informed decisions. CoPilot’s context-rich Q&A directly improves productivity and reduces costs in typical Q&A applications such as call centers, customer services, and knowledge search.
Furthermore, by merging a document knowledge graph and an existing business graph (e.g., product graph) into one intelligence graph, TigerGraph CoPilot can tackle problems that cannot be addressed by other RAG solutions. For example, by combining customers’ purchase history with product graphs, CoPilot can make more accurate personalized recommendations when customers type in their search queries or ask for recommendations. By combining patients’ medical history with healthcare graphs, doctors or health specialists can get more useful information about the patients to provide better diagnoses or treatments.
TigerGraph CoPilot addresses both the complex challenges associated with data management and analysis and the serious shortcomings of LLMs for business applications. By leveraging the power of natural language processing and advanced algorithms, organizations can unlock transformative business insights while navigating data overload and accessibility barriers. By tapping graph-based RAG, they can ensure the accuracy and relevance of LLM output.
CoPilot allows a wider range of users to leverage data effectively, driving informed decision-making and optimizing resource allocation across organizations. We believe it is a significant step forward in democratizing data access and empowering organizations to harness the full potential of their data assets.
Hamid Azzawe is CEO of TigerGraph.
—
Generative AI Insights provides a venue for technology leaders—including vendors and other outside contributors—to explore and discuss the challenges and opportunities of generative artificial intelligence. The selection is wide-ranging, from technology deep dives to case studies to expert opinion, but also subjective, based on our judgment of which topics and treatments will best serve InfoWorld’s technically sophisticated audience. InfoWorld does not accept marketing collateral for publication and reserves the right to edit all contributed content. Contact doug_dineley@foundryco.com.
Next read this:
Posted by Richy George on 29 April, 2024
At the end of March 2024, Mike Stonebraker announced in a blog post the release of DBOS Cloud, “a transactional serverless computing platform, made possible by a revolutionary new operating system, DBOS, that implements OS services on top of a distributed database.” That sounds odd, to put it mildly, but it makes more sense when you read the origin story:
The idea for DBOS (DataBase oriented Operating System) originated 3 years ago with my realization that the state an operating system must maintain (files, processes, threads, messages, etc.) has increased in size by about 6 orders of magnitude since I began using Unix on a PDP-11/40 in 1973. As such, storing OS state is a database problem. Also, Linux is legacy code at the present time and is having difficulty making forward progress. For example there is no multi-node version of Linux, requiring people to run an orchestrator such as Kubernetes. When I heard a talk by Matei Zaharia in which he said Databricks could not use traditional OS scheduling technology at the scale they were running and had turned to a DBMS solution instead, it was clear that it was time to move the DBMS into the kernel and build a new operating system.”
If you don’t know Stonebraker, he’s been a database-focused computer scientist (and professor) since the early 1970s, when he and his UC Berkeley colleagues Eugene Wong and Larry Rowe founded Ingres. Ingres later inspired Sybase, which was eventually the basis for Microsoft SQL Server. After selling Ingres to Computer Associates, Stonebraker and Rowe started researching Postgres, which later became PostgreSQL and also evolved into Illustra, which was purchased by Informix.
I heard Stonebraker talk about Postgres at a DBMS conference in 1980. What I got out of that talk, aside from an image of “jungle drums” calling for SQL, was the idea that you could add support for complex data types to the database by implementing new index types, extending the query language, and adding support for that to the query parser and optimizer. The example he used was geospatial information, and he explained one kind of index structure that would make 2D geometric database queries go very fast. (This facility eventually became PostGIS. The R-tree currently used by default in PostGIS GiST indexes wasn’t invented until 1984, so Mike was probably talking about the older quadtree index.)
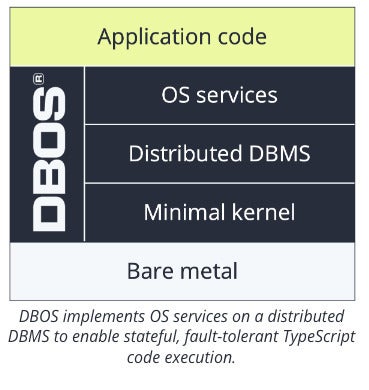
Skipping ahead 44 years, it should surprise precisely nobody in the database field that DBOS uses a distributed version of PostgreSQL as its kernel database layer.
The DBOS system diagram makes it clear that a database is part of the OS kernel. The distributed database relies on a minimal kernel, but sits under the OS services instead of running in the application layer as a normal database would.
DBOS Transact, an open-source TypeScript framework, supports Postgres-compatible transactions, reliable workflow orchestration, HTTP serving using GET and POST, communication with external services and third-party APIs, idempotent requests using UUID keys, authentication and authorization, Kafka integration with exactly-once semantics, unit testing, and self-hosting. DBOS Cloud, a transactional serverless platform for deploying DBOS Transact applications, supports serverless app deployment, time-travel debugging, cloud database management, and observability.
Let’s highlight some major areas of interest.
The code shown in the screenshot below demonstrates transactions, as well as HTTP serving using GET. It’s worthwhile to read the code closely. It’s only 18 lines, not counting blank lines.
The first import (line 1) brings in the DBOS SDK classes that we’ll need. The second import (line 2) brings in the Knex.js SQL query builder, which handles sending the parameterized query to the Postgres database and returning the resulting rows. The database table schema is defined in lines 4 through 8; the only columns are a name string and a greet_count integer.
There is only one method in the Hello class, helloTransaction. It is wrapped in @GetApi and @Transaction decorators, which respectively cause the method to be served in response to an HTTP GET request on the path /greeting/ followed by the username parameter you want to pass in and wrap the database call in a transaction, so that two instances can’t update the database simultaneously.
The database query string (line 16) uses PostgreSQL syntax to try to insert a row into the database for the supplied name and an initial count of 1. If the row already exists, then the ON CONFLICT trigger runs an update operation that increments the count in the database.
Line 17 uses Knex.js to send the SQL query to the DBOS system database and retrieves the result. Line 18 pulls the count out of the first row of results and returns the greeting string to the calling program.
The use of SQL and a database for what feels like should be a core in-memory system API, such as a Linux atomic counter or a Windows interlocked variable, seems deeply weird. Nevertheless, it works.
This TypeScript code for a Hello class is generated when you perform a DBOS create operation. As you can see, it relies on the @GetApi and @Transaction decorators to serve the function from HTTP GET requests and run the function as a database transaction.
When you run an application in DBOS Cloud it records every step and change it makes (the workflow) in the database. You can debug that using Visual Studio Code and the DBOS Time Travel Debugger extension. The time-travel debugger allows you to debug your DBOS application against the database as it existed at the time the selected workflow originally executed.
To perform time-travel debugging, you first start with a CodeLens to list saved trace workflows. Once you choose the one you want, you can debug it using Visual Studio Code with a plugin, or from the command line.
Time-travel debugging with a saved workflow looks very much like ordinary debugging in Visual Studio Code. The code being debugged is the same Hello class you saw earlier.
The DBOS Quickstart tutorial requires Node.js 20 or later and a PostgreSQL database you can connect to, either locally, in a Docker container, or remotely. I already had Node.js v20.9.0 installed on my M1 MacBook, but I upgraded it to v20.12.1 from the Node.js website.
I didn’t have PostgreSQL installed, so I downloaded and ran the interactive installer for v16.2 from EnterpriseDB. This installer creates a full-blown macOS server and applications. If I had used Homebrew instead, it would have created command-line applications, and if I had used Postgres.app, I would have gotten a menu-bar app.
The Quickstart proper starts by creating a DBOS app directory using Node.js.
martinheller@Martins-M1-MBP ~ % npx -y @dbos-inc/create@latest -n myapp
Merged .gitignore files saved to myapp/.gitignore
added 590 packages, and audited 591 packages in 25s
found 0 vulnerabilities
added 1 package, and audited 592 packages in 1s
found 0 vulnerabilities
added 129 packages, and audited 721 packages in 5s
found 0 vulnerabilities
Application initialized successfully!
Then you configure the app to use your Postgres server and export your Postgres password into an enviroment variable.
martinheller@Martins-M1-MBP ~ % cd myapp
martinheller@Martins-M1-MBP myapp % npx dbos configure
? What is the hostname of your Postgres server? localhost
? What is the port of your Postgres server? 5432
? What is your Postgres username? postgres
martinheller@Martins-M1-MBP myapp % export PGPASSWORD=*********
After that, you create a “Hello” database using Node.js and Knex.js.
martinheller@Martins-M1-MBP myapp % npx dbos migrate
2024-04-09 15:01:42 [info]: Starting migration: creating database hello if it does not exist
2024-04-09 15:01:42 [info]: Database hello does not exist, creating...
2024-04-09 15:01:42 [info]: Executing migration command: npx knex migrate:latest
2024-04-09 15:01:43 [info]: Batch 1 run: 1 migrations
2024-04-09 15:01:43 [info]: Creating DBOS tables and system database.
2024-04-09 15:01:43 [info]: Migration successful!
With that complete, you build and run the DBOS app locally.
martinheller@Martins-M1-MBP myapp % npm run build
npx dbos start

> myapp@0.0.1 build
> tsc

2024-04-09 15:02:30 [info]: Workflow executor initialized
2024-04-09 15:02:30 [info]: HTTP endpoints supported:
2024-04-09 15:02:30 [info]:     GET   :  /greeting/:user
2024-04-09 15:02:30 [info]: DBOS Server is running at http://localhost:3000
2024-04-09 15:02:30 [info]: DBOS Admin Server is running at http://localhost:3001
^C
At this point, you can browse to http://localhost:3000 to test the application. That done, you register for the DBOS Cloud and provision your own database there.
martinheller@Martins-M1-MBP myapp % npx dbos-cloud register -u meheller
2024-04-09 15:11:35 [info]: Welcome to DBOS Cloud!
2024-04-09 15:11:35 [info]: Before creating an account, please tell us a bit about yourself!
Enter First/Given Name: Martin
Enter Last/Family Name: Heller
Enter Company: self
2024-04-09 15:12:06 [info]: Please authenticate with DBOS Cloud!
Login URL: https://login.dbos.dev/activate?user_code=QWKW-TXTB
2024-04-09 15:12:12 [info]: Waiting for login...
2024-04-09 15:12:17 [info]: Waiting for login...
2024-04-09 15:12:22 [info]: Waiting for login...
2024-04-09 15:12:27 [info]: Waiting for login...
2024-04-09 15:12:32 [info]: Waiting for login...
2024-04-09 15:12:38 [info]: Waiting for login...
2024-04-09 15:12:44 [info]: meheller successfully registered!
martinheller@Martins-M1-MBP myapp % npx dbos-cloud db provision iw_db -U meheller
Database Password: ********
2024-04-09 15:19:22 [info]: Successfully started provisioning database: iw_db
2024-04-09 15:19:28 [info]: {"PostgresInstanceName":"iw_db","HostName":"userdb-51fcc211-6ed3-4450-a90e-0f864fc1066c.cvc4gmaa6qm9.us-east-1.rds.amazonaws.com","Status":"available","Port":5432,"DatabaseUsername":"meheller","AdminUsername":"meheller"}
2024-04-09 15:19:28 [info]: Database successfully provisioned!
Finally, you can register and deploy your app in the DBOS Cloud.
martinheller@Martins-M1-MBP myapp % npx dbos-cloud app register -d iw_db
2024-04-09 15:20:09 [info]: Loaded application name from package.json: myapp
2024-04-09 15:20:09 [info]: Registering application: myapp
2024-04-09 15:20:11 [info]: myapp ID: d8806829-c5b8-4df0-8b5a-2d1bf87c3322
2024-04-09 15:20:11 [info]: Successfully registered myapp!
martinheller@Martins-M1-MBP myapp % npx dbos-cloud app deploy
2024-04-09 15:20:35 [info]: Loaded application name from package.json: myapp
2024-04-09 15:20:35 [info]: Submitting deploy request for myapp
2024-04-09 15:21:09 [info]: Submitted deploy request for myapp. Assigned version: 1712676035
2024-04-09 15:21:13 [info]: Waiting for myapp with version 1712676035 to be available
2024-04-09 15:21:21 [info]: Successfully deployed myapp!
2024-04-09 15:21:21 [info]: Access your application at https://meheller-myapp.cloud.dbos.dev/
The “Hello” application running in the DBOS Cloud counts every greeting. It uses the code you saw earlier.
The “Hello” application does illustrate some of the core features of DBOS Transact and the DBOS Cloud, but it’s so basic that it’s barely a toy. The Programming Quickstart adds a few more details, and it’s worth your time to go through it. You’ll learn how to use communicator functions to access third-party services (email, in this example) as well as how to compose reliable workflows. You’ll literally interrupt the workflow and restart it without re-sending the email: DBOS workflows always run to completion and each of their operations executes once and only once. That’s possible because DBOS persists the output of each step in your database.
Once you’ve understood the programming Quickstart, you’ll be ready to try out the two DBOS demo applications, which do rise to the level of being toys. Both demos use Next.js for their front ends, and both use DBOS workflows, transactions, and communicators.
The first demo, E-Commerce, is a web shopping and payment processing system. It’s worthwhile reading the Under the Covers section of the README in the demo’s repository to understand how it works and how you might want to upgrade it to, for example, use a real-world payment provider.
The second demo, YKY Social, simulates a simple social network, and uses TypeORM rather than Knex.js for its database code. It also uses Amazon S3 for profile photos. If you’re serious about using DBOS yourself, you should work though both demo applications.
I have to say that DBOS and DBOS Cloud look very interesting. Reliable execution and time-travel debugging, for example, are quite desirable. On the other hand, I wouldn’t want to build a real application on DBOS or DBOS Cloud at this point. I have lots of questions, starting with “How does it scale in practice?” and probably ending with “How much will it cost at X scale?”
I mentioned earlier that DBOS code looks weird but works. I would imagine that any programming shop considering writing an application on it would be discouraged or even repelled by the “it looks weird” part, as developers tend to be set in their ways until what they are doing no longer works.
I also have to point out that the current implementation of DBOS is very far from the system diagram you saw near the beginning of this review. Where’s the minimal kernel? DBOS currently runs on macOS, Linux, and Windows. None of those are minimal kernels. DBOS Cloud currently runs on AWS. Again, not a minimal kernel.
So, overall, DBOS is a tantalizing glimpse of something that may eventually turn out to be cool. It’s new and shiny, and it comes from smart people, but it will be awhile before it could possibly become a mainstream system.
—
Cost: Free with usage limits; paid plans require you to contact sales.
Platform: macOS, Linux, Windows, AWS.
Next read this:
Posted by Richy George on 29 April, 2024
At the end of March 2024, Mike Stonebraker announced in a blog post the release of DBOS Cloud, “a transactional serverless computing platform, made possible by a revolutionary new operating system, DBOS, that implements OS services on top of a distributed database.” That sounds odd, to put it mildly, but it makes more sense when you read the origin story:
The idea for DBOS (DataBase oriented Operating System) originated 3 years ago with my realization that the state an operating system must maintain (files, processes, threads, messages, etc.) has increased in size by about 6 orders of magnitude since I began using Unix on a PDP-11/40 in 1973. As such, storing OS state is a database problem. Also, Linux is legacy code at the present time and is having difficulty making forward progress. For example there is no multi-node version of Linux, requiring people to run an orchestrator such as Kubernetes. When I heard a talk by Matei Zaharia in which he said Databricks could not use traditional OS scheduling technology at the scale they were running and had turned to a DBMS solution instead, it was clear that it was time to move the DBMS into the kernel and build a new operating system.”
If you don’t know Stonebraker, he’s been a database-focused computer scientist (and professor) since the early 1970s, when he and his UC Berkeley colleagues Eugene Wong and Larry Rowe founded Ingres. Ingres later inspired Sybase, which was eventually the basis for Microsoft SQL Server. After selling Ingres to Computer Associates, Stonebraker and Rowe started researching Postgres, which later became PostgreSQL and also evolved into Illustra, which was purchased by Informix.
I heard Stonebraker talk about Postgres at a DBMS conference in 1980. What I got out of that talk, aside from an image of “jungle drums” calling for SQL, was the idea that you could add support for complex data types to the database by implementing new index types, extending the query language, and adding support for that to the query parser and optimizer. The example he used was geospatial information, and he explained one kind of index structure that would make 2D geometric database queries go very fast. (This facility eventually became PostGIS. The R-tree currently used by default in PostGIS GiST indexes wasn’t invented until 1984, so Mike was probably talking about the older quadtree index.)
Skipping ahead 44 years, it should surprise precisely nobody in the database field that DBOS uses a distributed version of PostgreSQL as its kernel database layer.
The DBOS system diagram makes it clear that a database is part of the OS kernel. The distributed database relies on a minimal kernel, but sits under the OS services instead of running in the application layer as a normal database would.
DBOS Transact, an open-source TypeScript framework, supports Postgres-compatible transactions, reliable workflow orchestration, HTTP serving using GET and POST, communication with external services and third-party APIs, idempotent requests using UUID keys, authentication and authorization, Kafka integration with exactly-once semantics, unit testing, and self-hosting. DBOS Cloud, a transactional serverless platform for deploying DBOS Transact applications, supports serverless app deployment, time-travel debugging, cloud database management, and observability.
Let’s highlight some major areas of interest.
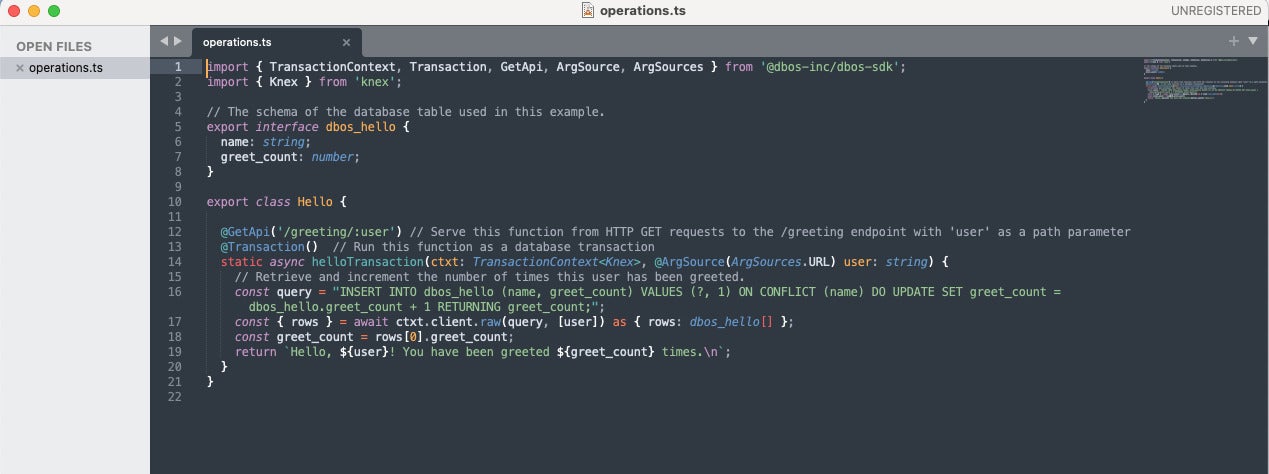
The code shown in the screenshot below demonstrates transactions, as well as HTTP serving using GET. It’s worthwhile to read the code closely. It’s only 18 lines, not counting blank lines.
The first import (line 1) brings in the DBOS SDK classes that we’ll need. The second import (line 2) brings in the Knex.js SQL query builder, which handles sending the parameterized query to the Postgres database and returning the resulting rows. The database table schema is defined in lines 4 through 8; the only columns are a name string and a greet_count integer.
There is only one method in the Hello class, helloTransaction. It is wrapped in @GetApi and @Transaction decorators, which respectively cause the method to be served in response to an HTTP GET request on the path /greeting/ followed by the username parameter you want to pass in and wrap the database call in a transaction, so that two instances can’t update the database simultaneously.
The database query string (line 16) uses PostgreSQL syntax to try to insert a row into the database for the supplied name and an initial count of 1. If the row already exists, then the ON CONFLICT trigger runs an update operation that increments the count in the database.
Line 17 uses Knex.js to send the SQL query to the DBOS system database and retrieves the result. Line 18 pulls the count out of the first row of results and returns the greeting string to the calling program.
The use of SQL and a database for what feels like should be a core in-memory system API, such as a Linux atomic counter or a Windows interlocked variable, seems deeply weird. Nevertheless, it works.
This TypeScript code for a Hello class is generated when you perform a DBOS create operation. As you can see, it relies on the @GetApi and @Transaction decorators to serve the function from HTTP GET requests and run the function as a database transaction.
When you run an application in DBOS Cloud it records every step and change it makes (the workflow) in the database. You can debug that using Visual Studio Code and the DBOS Time Travel Debugger extension. The time-travel debugger allows you to debug your DBOS application against the database as it existed at the time the selected workflow originally executed.
To perform time-travel debugging, you first start with a CodeLens to list saved trace workflows. Once you choose the one you want, you can debug it using Visual Studio Code with a plugin, or from the command line.
Time-travel debugging with a saved workflow looks very much like ordinary debugging in Visual Studio Code. The code being debugged is the same Hello class you saw earlier.
The DBOS Quickstart tutorial requires Node.js 20 or later and a PostgreSQL database you can connect to, either locally, in a Docker container, or remotely. I already had Node.js v20.9.0 installed on my M1 MacBook, but I upgraded it to v20.12.1 from the Node.js website.
I didn’t have PostgreSQL installed, so I downloaded and ran the interactive installer for v16.2 from EnterpriseDB. This installer creates a full-blown macOS server and applications. If I had used Homebrew instead, it would have created command-line applications, and if I had used Postgres.app, I would have gotten a menu-bar app.
The Quickstart proper starts by creating a DBOS app directory using Node.js.
martinheller@Martins-M1-MBP ~ % npx -y @dbos-inc/create@latest -n myapp
Merged .gitignore files saved to myapp/.gitignore
added 590 packages, and audited 591 packages in 25s
found 0 vulnerabilities
added 1 package, and audited 592 packages in 1s
found 0 vulnerabilities
added 129 packages, and audited 721 packages in 5s
found 0 vulnerabilities
Application initialized successfully!
Then you configure the app to use your Postgres server and export your Postgres password into an enviroment variable.
martinheller@Martins-M1-MBP ~ % cd myapp
martinheller@Martins-M1-MBP myapp % npx dbos configure
? What is the hostname of your Postgres server? localhost
? What is the port of your Postgres server? 5432
? What is your Postgres username? postgres
martinheller@Martins-M1-MBP myapp % export PGPASSWORD=*********
After that, you create a “Hello” database using Node.js and Knex.js.
martinheller@Martins-M1-MBP myapp % npx dbos migrate
2024-04-09 15:01:42 [info]: Starting migration: creating database hello if it does not exist
2024-04-09 15:01:42 [info]: Database hello does not exist, creating...
2024-04-09 15:01:42 [info]: Executing migration command: npx knex migrate:latest
2024-04-09 15:01:43 [info]: Batch 1 run: 1 migrations
2024-04-09 15:01:43 [info]: Creating DBOS tables and system database.
2024-04-09 15:01:43 [info]: Migration successful!
With that complete, you build and run the DBOS app locally.
martinheller@Martins-M1-MBP myapp % npm run build
npx dbos start

> myapp@0.0.1 build
> tsc

2024-04-09 15:02:30 [info]: Workflow executor initialized
2024-04-09 15:02:30 [info]: HTTP endpoints supported:
2024-04-09 15:02:30 [info]:     GET   :  /greeting/:user
2024-04-09 15:02:30 [info]: DBOS Server is running at http://localhost:3000
2024-04-09 15:02:30 [info]: DBOS Admin Server is running at http://localhost:3001
^C
At this point, you can browse to http://localhost:3000 to test the application. That done, you register for the DBOS Cloud and provision your own database there.
martinheller@Martins-M1-MBP myapp % npx dbos-cloud register -u meheller
2024-04-09 15:11:35 [info]: Welcome to DBOS Cloud!
2024-04-09 15:11:35 [info]: Before creating an account, please tell us a bit about yourself!
Enter First/Given Name: Martin
Enter Last/Family Name: Heller
Enter Company: self
2024-04-09 15:12:06 [info]: Please authenticate with DBOS Cloud!
Login URL: https://login.dbos.dev/activate?user_code=QWKW-TXTB
2024-04-09 15:12:12 [info]: Waiting for login...
2024-04-09 15:12:17 [info]: Waiting for login...
2024-04-09 15:12:22 [info]: Waiting for login...
2024-04-09 15:12:27 [info]: Waiting for login...
2024-04-09 15:12:32 [info]: Waiting for login...
2024-04-09 15:12:38 [info]: Waiting for login...
2024-04-09 15:12:44 [info]: meheller successfully registered!
martinheller@Martins-M1-MBP myapp % npx dbos-cloud db provision iw_db -U meheller
Database Password: ********
2024-04-09 15:19:22 [info]: Successfully started provisioning database: iw_db
2024-04-09 15:19:28 [info]: {"PostgresInstanceName":"iw_db","HostName":"userdb-51fcc211-6ed3-4450-a90e-0f864fc1066c.cvc4gmaa6qm9.us-east-1.rds.amazonaws.com","Status":"available","Port":5432,"DatabaseUsername":"meheller","AdminUsername":"meheller"}
2024-04-09 15:19:28 [info]: Database successfully provisioned!
Finally, you can register and deploy your app in the DBOS Cloud.
martinheller@Martins-M1-MBP myapp % npx dbos-cloud app register -d iw_db
2024-04-09 15:20:09 [info]: Loaded application name from package.json: myapp
2024-04-09 15:20:09 [info]: Registering application: myapp
2024-04-09 15:20:11 [info]: myapp ID: d8806829-c5b8-4df0-8b5a-2d1bf87c3322
2024-04-09 15:20:11 [info]: Successfully registered myapp!
martinheller@Martins-M1-MBP myapp % npx dbos-cloud app deploy
2024-04-09 15:20:35 [info]: Loaded application name from package.json: myapp
2024-04-09 15:20:35 [info]: Submitting deploy request for myapp
2024-04-09 15:21:09 [info]: Submitted deploy request for myapp. Assigned version: 1712676035
2024-04-09 15:21:13 [info]: Waiting for myapp with version 1712676035 to be available
2024-04-09 15:21:21 [info]: Successfully deployed myapp!
2024-04-09 15:21:21 [info]: Access your application at https://meheller-myapp.cloud.dbos.dev/
The “Hello” application running in the DBOS Cloud counts every greeting. It uses the code you saw earlier.
The “Hello” application does illustrate some of the core features of DBOS Transact and the DBOS Cloud, but it’s so basic that it’s barely a toy. The Programming Quickstart adds a few more details, and it’s worth your time to go through it. You’ll learn how to use communicator functions to access third-party services (email, in this example) as well as how to compose reliable workflows. You’ll literally interrupt the workflow and restart it without re-sending the email: DBOS workflows always run to completion and each of their operations executes once and only once. That’s possible because DBOS persists the output of each step in your database.
Once you’ve understood the programming Quickstart, you’ll be ready to try out the two DBOS demo applications, which do rise to the level of being toys. Both demos use Next.js for their front ends, and both use DBOS workflows, transactions, and communicators.
The first demo, E-Commerce, is a web shopping and payment processing system. It’s worthwhile reading the Under the Covers section of the README in the demo’s repository to understand how it works and how you might want to upgrade it to, for example, use a real-world payment provider.
The second demo, YKY Social, simulates a simple social network, and uses TypeORM rather than Knex.js for its database code. It also uses Amazon S3 for profile photos. If you’re serious about using DBOS yourself, you should work though both demo applications.
I have to say that DBOS and DBOS Cloud look very interesting. Reliable execution and time-travel debugging, for example, are quite desirable. On the other hand, I wouldn’t want to build a real application on DBOS or DBOS Cloud at this point. I have lots of questions, starting with “How does it scale in practice?” and probably ending with “How much will it cost at X scale?”
I mentioned earlier that DBOS code looks weird but works. I would imagine that any programming shop considering writing an application on it would be discouraged or even repelled by the “it looks weird” part, as developers tend to be set in their ways until what they are doing no longer works.
I also have to point out that the current implementation of DBOS is very far from the system diagram you saw near the beginning of this review. Where’s the minimal kernel? DBOS currently runs on macOS, Linux, and Windows. None of those are minimal kernels. DBOS Cloud currently runs on AWS. Again, not a minimal kernel.
So, overall, DBOS is a tantalizing glimpse of something that may eventually turn out to be cool. It’s new and shiny, and it comes from smart people, but it will be awhile before it could possibly become a mainstream system.
—
Cost: Free with usage limits; paid plans require you to contact sales.
Platform: macOS, Linux, Windows, AWS.
Next read this:
Posted by Richy George on 16 April, 2024

Open-source database provider Qdrant has made available Qdrant Hybrid Cloud, a dedicated vector database to be offered in a managed hybrid cloud model.
Qdrant, the open-source foundation of both Qdrant Cloud and Qdrant Hybrid Cloud, is a vector similarity search engine and vector database written in Rust. Qdrant offers a set of features for performance optimization and can handle billions of vectors with scale and memory safety, the company said.
Qdrant said it lets businesses deploy vector databases across any cloud provider, on-prem data center, or edge location, thus ensuring performance, security, and cost efficiency for AI-driven applications. Vector databases have emerged as a critical component for building generative AI applications.
Qdrant Hybrid Cloud lets customers deploy a vector database in their chosen environment without sacrificing the benefits of a managed cloud service. In addition to running on Google Cloud Platform and Microsoft Azure, Qdrant Hybrid Cloud can run in Oracle Cloud Infrastructure, Red Hat OpenShift, Vultur, DigitalOcean, OVHcloud, Scaleway, Stackit, Civo, or any other private or public infrastructure with Kubernetes support.
Next read this:
Posted by Richy George on 9 April, 2024
Google Cloud is adding capabilities driven by its proprietary large language model, Gemini to its database offerings, which include Bigtable, Spanner, Memorystore for Redis, Firestore, CloudSQL for MySQL, and AlloyDB for PostgreSQL, the company announced at its annual Next conference.
The Gemini-driven capabilities, which are currently in public preview, include SQL generation, and AI assistance in managing and migrating databases.
Last year, the company added Duet AI, now rebranded to Gemini, in Spanner and its Database Migration Service.
The SQL generation capability can be accessed via the company’s SQL editor named Database Studio to be found inside Google’s Cloud Console.
As the name suggests, this capability allows developers to easily generate, summarize, and fix SQL code with intelligent code assistance, code completion, and guidance directly inside Database Studio, which in turn improves productivity, the company said, adding that Database Studio supports both MySQL and PostgreSQL dialects.
In addition, Database Studio comes with a context-aware chat interface that can take input in natural language to help build database applications faster, according to the company.
Google is not the only database provider that has added SQL code generation to its list of capabilities, analysts said.
“SQL code generation with assistance from generative AI has become one of the low-hanging fruits for generative AI over the past year,” said Tony Baer, principal analyst at dbInsight.
“The new breed of generative AI database code assistants should eventually have a key advantage over those assistants that cater to general-purpose languages, which is that they are database-specific and can therefore read the metadata of databases to not just form, but also optimize SQL code,” Baer explained.
In order to help manage databases better, the cloud service provider is adding a new feature called the Database Center, which will allow operators to manage an entire fleet of databases from a single pane.
Database Center also provides intelligent dashboards to proactively assess availability, data protection, security, and compliance posture, the company said.
Further, the company is infusing Gemini into the Database Center via a natural language-based chat window that will allow enterprise teams to interact with the databases and find more insights about them.
The chat window also can be used to generate troubleshooting tips for database-related issues, the company said.
Google’s idea to have a single pane to manage multiple databases takes inspiration from Oracle, according to Baer.
While Oracle provides the capability for multiple instances of the same databases, which is multimodal, Google extends the capability to a heterogenous collection of databases, Baer said.
“Having central control means that enterprises can be consistent with their policies for security, data access, and service level agreements (SLAs). That’s a major step toward the simplification that we expect from the cloud,” the principal analyst explained.
Google has also extended Gemini to its Database Migration Service, which earlier had support for Duet AI.
Gemini’s improved features will make the service better, the company said, adding that Gemini can help convert database-resident code, such as stored procedures, functions to PostgreSQL dialect.
Additionally, Gemini-powered database migration also focuses on explaining the translation of the code with a side-by-side comparison of dialects, along with detailed explanations of the code and recommendations.
The focus on explaining the code has been planned to help upskill and retrain SQL developers, the company said.
In addition to powering databases with Gemini, Google has added new features to AlloyDB AI.
AlloyDB AI, which was introduced last year as part of its AlloyDB for PostgreSQL database service, is a suite of integrated capabilities targeted at helping developers build generative AI-based applications using real-time data.
The new features include allowing generative AI-based applications to query data with natural language and a new type of database view.
The enablement of querying data with natural language will allow AI-based applications to respond to more sets of questions from enterprise teams, the company said.
On the other hand, the new type of database view — parameterized secure view — allows enterprise teams to secure data based on the end-users’ context.
AlloyDB AI can be downloaded using AlloyDB Omni, which has been made generally available. AlloyDB Omni is a downloadable version of Google Cloud’s PostgreSQL-compatible database service.
Other updates include the addition of Bigtable Data Boost, similar to Spanner Data Boost released last year, and performance enhancements to Memorystore for Redis.
Next read this:


This post is intended for businesses and other organizations interested... Read more →

This post is intended for businesses and other organizations interested... Read more →

This post is intended for businesses and other organizations interested... Read more →

This post is intended for businesses and other organizations interested... Read more →

This post is intended for businesses and other organizations interested... Read more →
Copyright 2015 - InnovatePC - All Rights Reserved
Site Design By Digital web avenue